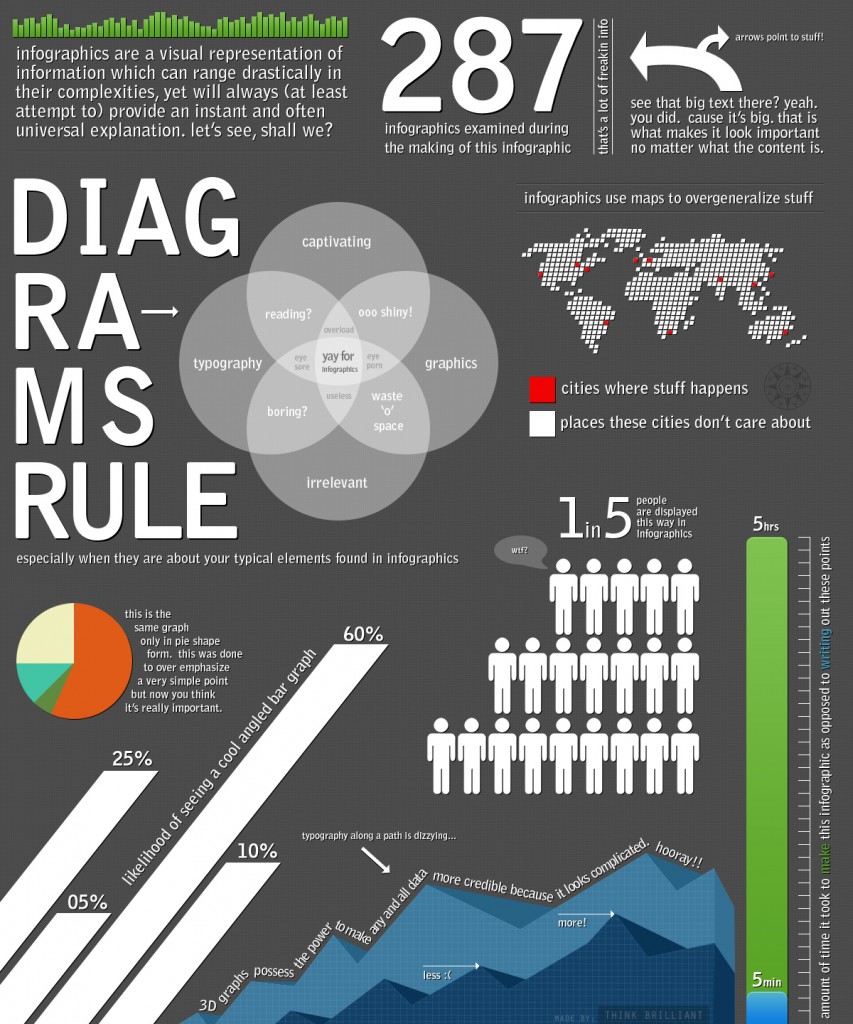
Assuming you haven’t lost power at your home and been off line in the past couple years, you are fully aware of the proliferation of infographics as a marketing and communication tool. Perhaps a revolution in online content, not since online video has the way we consume content online evolved so effectively – and I’d argue infographics are far more compelling, mirroring our means of content consumption online (text) rather than emulating TV. Infographics are engaging, viral, and simple at the same time. They communicate complex concepts and summarize data elegantly and efficiently. On the remote chance that you have been in the dark these past months, perhaps an infographic can best explain an infographic.

I’m not sure I can add more than what ThinkBrilliant has so effectively done there.
Also referred to as Info Art or Data Visualization, the means of communication is becoming increasingly popular as we look simplify the growing amount of data at our disposal.
Article Highlights
Marketing with Infographics
More than a form of engaging content, infographics are incredibly viral; easily resulting in hundreds of tweets, likes, shares, and links. Your work with infographics needs to recognize that broad impact the graphics will have on your brand, SEO, social media channels, and customers. Valuing them for only one purpose will disappoint you.
As a result, planning an ROI in an infographic is difficult, perhaps more so than a blog post, given the richer nature of the content. I’d suggest setting a benchmark against which to plan the effectiveness of infographics on your behalf. Most important in measuring the return on an investment in graphics is valuing the social and link equity built on behalf of your business; arguably, more than the traffic and leads from the effort.
- Links – If you don’t benefit from 20-30 quality links (PR of 4 or more) then go back to the drawing board. Evaluate your topic, the quality of the design, and your outreach on behalf of your infographic.
- Social – Assuming your site effectively leverages Facebook, Twitter, StumbleUpon and other social networks to enable your audience to share content, shoot for 400-500 social instances on your behalf.
- Traffic – Measure this over a long term. In the first few days, you’ll experience triple digit growth in traffic to your site. Let the elation at your success die down! That traffic is of far less value to you than that which you’ll continue to receive over time once the viral excitement for your shiny new object wanes and more qualified search volume sends contextually relevant users to your site. I’ve seen long term, sustained increases in new visits as high as 25% (though, keep in mind, I work with startups that are often working with very little base traffic). Set a number reasonable to your business; 1-2% points isn’t unreasonable for a large site.
- Leads – Certainly, dependent on your average daily volume and expectations for traffic, leads are the most variable of this benchmark. I’d set it around 50-100 and see how your first few infographics deliver.
I made a very important point there. You MUST promote your infographic as though it were a press release if you expect to truly benefit from the creative work done. There’s the catch. Infographics come at a much greater cost than blog posts or even press releases supported by an agency (or at least, they should have a greater cost). Involved in your infographic are researchers, designers, social marketing experts, and, frankly, the relationships you’ve developed with your industry and the online community at large that determine the effectiveness of your infographic. You are developing an infographic to connect with your audience, constituents, and partners in so many different ways such that you might benefit in so many ways. That isn’t as simple as whipping up a graphic.
Developing an Infographic (and how much will it cost?)
Don’t let me scare you off, if you want to dip your toe in the water and sample what an infographic can mean for your business, you can find designers (overseas) who can create exceptional designs for a few hundred dollars.
I just heard a great sigh of frustration out of every U.S. based designer, agency, and social marketing service provider
Yes, you CAN get an infographic done for a few hundred dollars. But let me put my designer friends at ease by pointing out that I’m not at all encouraging that approach. In the interest of full disclosure as you figure out how to get your done, the truth is, you can do it on the cheap.
In reality, a quality infographic, well researched, and supported socially, virally, and with influencers, will run a couple thousand dollars. What you need to be sure you are getting though, when evaluating designers and agencies who all quote a few thousand bucks, is that ongoing promotion of the work they’ve done on your behalf through major sites that love infographics (Mashable comes to mind). What you are paying for is great design at about $100 an hour, research, AND social marketing and PR to attain those numbers we benchmarked above.
Compared to the cost of a great quality blog post ($75), rest assured, you are going to be challenged convincing the purse strings at your organization to open up. Keep in mind the results to expect, contrast them to what you’ve been doing through your blog, and share with stakeholders the fact that many great startups have been built on the shoulders of amazing infographics (see Mint.com or Flowtown).
Once you’ve found a designer with which you are excited, expect the work to take a couple weeks and heavy dependence on you to help them understand your marketing strategy, tone, objectives, and industry.
Where do I find a great infographics designer?
Take a look at Jess3, Column Five Media, Hyperakt.com, or Dachis Group’s XPLANE. You can find fantastic designers in your own town or through design communities easily found online but keep in mind the indirect benefits you are looking for in a great infographic designer: will their work reach influencers?
I’ve been pleased with the work done through teams at an agency but with the right brand, internal marketing resources, and influence, you can probably accomplish as much yourself simply sourcing the design.
Long a fan of crowdsourcing, there is an interesting trend in the data visualization community that will be fun to watch. Just as logo design was impacted by the reach of the internet through Crowdspring and 99designs, you are going to be tempted to chase the cheap, almost crowdsourced services. Be careful, infographics design should be an intimate part of your marketing plan and the research, design, and social support of the work done with infographics demands more than a few hundred dollars thrown at a spot buy or contest. Of course, the same argument should be made of your brand and logo but then…
Introducing Visual.ly
Where working with infographics efficiently becomes more intriguing is in that, technically, you are working with data; and data, can be easily presented through charts, graphs, and icons. Charts, graphs, and icons can be whipped up in Powerpoint can’t they?
You’re going to love Visual.ly
And I’m hanging my head in shame at how poorly my transition just painted this very cool service.
Visual.ly is building three main segments to their business. Today, for the most part, it’s a search engine for existing infographics. Its scoring and ranking features create an engaging and effective experience for those trying to find infographics that reflect a dataset or design they have in mind. More, the search engine is a great resource for finding great designers. It aspires to be a source data from research and data oriented organizations, the government, and non-profits. Ultimately, where you might turn for the bulk of the research to be done on behalf of your own.
Therein lies the promise of some efficiency in developing infographics. The legwork you need to do today is best accomplished through Google, endlessly searching for reports, case studies, and stats to share. Visual.ly hopes to make that easier. But more than that, Visual.ly is doing some amazing work developing a web-based platform that actually creates the infographics for you; no graphic design experience or designer necessary.
You heard me right, they are exploring the possibilities in dynamically, automatically creating infographics. In minutes.
Sounds amazing no? And it will be. But not without it’s limitations (I suspect). Expect that the infographics to be available through their web based tools are either generic or of a structured format – there is no designer involved (other than initially as they set up the format) so if you are looking for something unique, you’ll have to stick with the professionals.
Don’t get me wrong, the promise is still terribly exciting. Exceptionally designed infographics for straightforward datasets and ideas (And there is no reason Visual.ly can’t accomplish these beautiful designs), at a much lower cost, enables us (you) to allocate dollars that would have otherwise been spent there to designers and agencies for more creative and unique designs. We have a few months to wait before the real power of Visual.ly is available to us but know that the founding team is comprised of the team behind the amazing work done with Mint’s blog.
We’re not without a taste. Using their Twitter Visualizer, a web based infographic developer they’ve already made available, I whipped up this, in about 5 minutes.
Pretty cool! Apparently I am a geek obsessed with work while Shawn Collins plays video games when he should be working on the next Affiliate Summit. And Shashi B is a strong connection between us.
Thanks to @AffiliateTip for being my guinea pig.


I have used KillerInfographics before, and got some really cool stuff for good prices. Why not list them too?
Thanks Jay, I’m going to add an update, an edit, shortly. I’ve been pleasantly surprised at the inbound feedback from shops such as yours. You’re right, there is a tier of services I failed to cover here; we’ll remedy that.
Why & How to Market with Infographics | @SEOBrien https://seobrien.com/why-how-to-market-with-infographics
RT @shashib: Why & How to Market with Infographics | @seobrien https://seobrien.com/why-how-to-market-with-infographics
RT @shashib: Why & How to Market with Infographics | @seobrien https://seobrien.com/why-how-to-market-with-infographics ^CK